Posts in Investing
Should investors worry about elections?

Globally, the most significant upcoming election is in the US, but of course, the UK election is also expected towards the end of this year.

There are similarities to US and UK politics in that it is generally a race between two parties, as the charts below show:

There appears to be greater party loyalty in the US despite how voters may feel about the leader. In all elections, the person who wins is often decided by a minority of people, the swing voters. Between 1952 and 1980, this was 12% of the electorate, and now it is thought to be around 3%.

In the UK, “swing voters” tend to revolve around age groups, and therefore, where US elections tend to be very tight, UK elections can see large majorities. Thatcher (1983 – 144 majority), Blair (1997 – 178 majority) and Johnson (2019 – 81 majority).

The question is, from a stock market perspective, does it matter who wins an election?

US Data

Two separate pieces of data indicate that annual US growth is better under a Democratic President.

The Economic Policy Institute (EPI) is a respected non-profit, non-partisan think tank. Due to its work, which is aimed at low—and middle-income families, some view it as more left-leaning.

The second piece of research is from the Joint Economic Committee, which is responsible for reporting the current economic condition of the United States and for making suggestions for improvement to the economy. This also indicates that growth is stronger under a Democratic President:

According to CNN data, the US stock market has performed better under the Democrats since 1945.

However, there isn't much difference if you consider data over a more extended period. Deutsche Bank provided this chart.

The key takeaway is that the data seems to suggest that the Democratic Party are better for the economy and markets. However, as we can see in the chart above, the actual returns have been broadly similar in recent years.

UK Data

Similar research is complicated to ascertain in the UK. However, this data from the Office for National Statistics from 1955 (Q1) to 2019 (Q2) shows annualised Gross Domestic Product (GDP).  The theory is that the higher the rate, the more the economy will grow. This slightly favours a Conservative Government.

The chart below is more relevant as it shows stock market returns.

However, this is hard to Judge as Labour from 1997 saw five financial shocks (Asian Financial Crisis, Russian Financial Crisis, Dot-com bubble bursts, September 11, and Global Financial Crisis) compared to the Conservatives from 2010 (Brexit referendum, Covid Pandemic, and Inflation).

To conclude

We cannot predict the outcome of the elections or what any new Government may or may not do. Evidence indicates that whichever party comes to power in the US and the UK makes little difference to long term stock market performance.

Stock markets and currency markets can be volatile before and after an election, but over the long term, they will adapt to the regime in power and the state of the economy. Events outside the government's control are often more likely to impact markets.

There are perhaps three things to consider irrespective of the elections:

  1. Equity valuations globally (excluding the US) remain at or below their long-term averages, meaning there are long-term opportunities for returns within diversified portfolios.

  2. The Inheritance Tax Band was set at £325,000 in 2009/10; this hasn’t changed at a time when house prices and other assets have.

  3. Allowances for capital gains and dividends have come down, meaning more investors are paying taxes.

In conclusion, we will not position (or reposition) our investment strategy based on any upcoming elections. We maintain our long-term strategies and adapt to any new legislation and tax allowances.


General disclaimer: The data has been sourced from external sources. Although we have looked to ensure this is as accurate as possible, we are not responsible. The blog is written personally and reflects the author's view; it does not necessarily reflect the opinions of Ifamax Wealth Management. Individuals wishing to buy any product or service because of this blog must seek advice or conduct their research before making any decision. The author will not be liable for decisions made because of this blog (particularly where no advice has been sought). Investors should note that past performance does not guide future performance, and investments can fall and rise.

The Big Five
DSCN5437.jpg

Investors love good stories. In recent years, many of these stories have centred around innovations that have fundamentally changed the way we live our lives. Some examples might include the release of the original Apple iPhone in 2007, the delivery of Tesla’s first electric cars in 2012 and the launch of Amazon Prime’s same-day delivery service in 2015 . No doubt, many of you will have had conversations with friends and family around the successes, failures, and prospects of some of the world’s largest firms and the goods and services they offer. In this note, we take a deeper look at the ‘Big Five’ tech companies – Amazon, Apple, Alphabet (Google), Facebook and Microsoft – through the lens of the long-term investor.

In what has been a turbulent year thus far, some larger firms have come through the first - and hopefully last - wave of the ongoing pandemic relatively unscathed. Those investors putting their nest eggs entirely in any combination of the ‘Big Five’ would appear to have done astonishingly well relative to something sensible like the MSCI All-Country World Index, which constitutes 3,000 of the world’s largest firms . At time of writing, Amazon’s share price has fared best, increasing 75% since the beginning of the year.

 Figure 1: The 'Big Five' have held up well so far this year

Data source: Morningstar Direct © All rights reserved. Returns in GBP from 01/01/2020 to 22/07/2020.

Data source: Morningstar Direct © All rights reserved. Returns in GBP from 01/01/2020 to 22/07/2020.

These types of firms tend to struggle to stay out of the headlines for one reason or another. Perhaps as a result, many of the investment funds found in ‘top buy’ lists - such as the one on AJ Bell’s Youinvest platform - have overweight positions in one or more of these stocks. The final column in the table below shows the weight of each ‘Big Five’ stock as it stands in the MSCI All-Country World Index.

If an investor were to adopt a purely passive investment strategy that owned each company as its proportional share of the world market, the final column would be that investor’s top 5 portfolio holdings at time of writing. Many of today’s most popular funds are making big bets on one or more of these companies, anticipating that the past will repeat itself moving forwards.

Table 1: AJ Bell's top traded funds in the past week

Data source: Morningstar Direct © All rights reserved. AJ Bell for top traded funds between 15/07/20 – 22/07/20.

Data source: Morningstar Direct © All rights reserved. AJ Bell for top traded funds between 15/07/20 – 22/07/20.

Sticking to the long-term view

The challenge for these managers, and others making similarly large bets, is that these are portfolios that will be needed to meet the needs of individuals over lifelong investment horizons, which for the vast majority of people means decades, not years. With the benefit of hindsight, managers who have placed their faith in these firms have stellar track records since Facebook’s IPO in 2012, as the table below highlights.

Table 2: ‘Big Five’ performance since Facebook’s IPO

Data source: Morningstar Direct © All rights reserved. Returns from Jun-12 to Jun-20.

Data source: Morningstar Direct © All rights reserved. Returns from Jun-12 to Jun-20.

An interesting exercise would be to investigate the outcomes of these firms over a longer period of time, for example 30-years seems more prudent. This is somewhat difficult given that 30-years ago, 3 of these firms did not exist, Mark Zuckerberg was 6-years old, Apple came in at 96th on Fortune’s 500 list of America’s largest firms and Microsoft had just launched Microsoft Office .

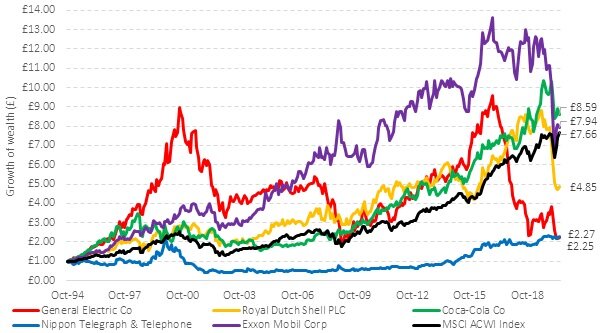
A partial solution to this problem is to perform the exercise from the perspective of an investor in 1996, which is the start of Financial Times’ public market capitalisation record . The ‘Class of 96 Big Five’ consisted of General Electric, Royal Dutch Shell, Coca-Cola, Nippon Telegraph and Telephone and Exxon Mobil. The chart below shows the outcomes of each firm over the past 26-years. A hypothetical investor with their assets invested in either Coca-Cola or Exxon would have just about beaten the market over this period, those in Royal Dutch Shell, Nippon Telegraph and Telephone and General Electric were not so lucky.

This experiment is illustrative only, one look at the chart below is enough to see that almost no investor would want to stomach the roller coaster ride they would have been on in any one of these single-stock portfolios.

Figure 2: The winners do not necessarily keep winning

Data source: Morningstar Direct © All rights reserved

Data source: Morningstar Direct © All rights reserved

Summary

The beauty of the approach you have adopted is that judgemental calls such as these are left to the aggregate view of all investors in the marketplace. No firm is immune to the risks and rewards of capitalism; be it competition from Costco or Walmart taking some of Amazon’s market share, publishing laws causing Facebook to apply heavy restrictions on its users or some breakthrough smartphone entering the marketplace that is years ahead of Apple – remember Nokia?

Rather than supposing that firms who have done well recently will continue to do well, systematic investors can rest easy knowing that they will participate in the upside of the next ‘Big Five’, the ‘Big Five’ after that and each subsequent ‘Big Five’. Those who can block out the noise of good stories and jumping on bandwagons are usually rewarded in this game.

Figure 3: Your eggs are in many baskets

next big 5.png
Source: Albion Strategic Consulting. For demonstrative purposes only.

Source: Albion Strategic Consulting. For demonstrative purposes only.

Risk Warning This newsletter does not constitute financial advice. Remember that your circumstances could change and you may have to cash in your investment when the value is low. The value of your investment and any income from it can go down as well as up and you may not get back the original amount invested. Past performance is not necessarily a guide to the future. If you are in any doubt you should seek financial advice.

Mitigating an unknown future
eye4Colour-march10-6513.jpg

One of the hardest concepts to grasp in investing is that a ‘good’ company is not always a better investment opportunity than a ‘bad’ company. If we believe that markets work pretty well – not unreasonable given that few investment professionals beat the market over time - and that they incorporate all public information into prices pretty quickly and efficiently, all of the ‘good’ and ‘bad’ news should already be reflected in these prices.  A ‘good’ company will have to do better than the aggregate expectation set by the market for its share price to rise and vice versa.  If a ‘bad’ company is in fact a less healthy company, it may have a higher expected long-term return, as risk and return are related.  

It is perhaps evident that if the market incorporates the aggregate forward-looking views of all investors, it becomes very difficult to choose which companies, sectors, and geographic markets are likely to do best, going forward.  In an uncertain world, where stock prices could move rapidly, and with magnitude, on the release of new information - which is itself a random process – then it makes good sense to ensure that an investment portfolio remains well diversified across companies, sectors and geographies.  Take a look at the chart below that illustrates how deeply diversified a globally equity portfolio can be.

 Figure 1: If you do not know which stocks are going to outperform well, own them all

Source: Albion Strategic Consulting. Data: Morningstar Direct © 2020. All rights reserved.

Source: Albion Strategic Consulting. Data: Morningstar Direct © 2020. All rights reserved.

The concentration risk in the US’s S&P500, is quite different.  

Figure 2: The US’s S&P500 is increasingly concentrated in a few names. 

Source: Albion Strategic Consulting. Data: Morningstar Direct © 2020. All rights reserved.

Source: Albion Strategic Consulting. Data: Morningstar Direct © 2020. All rights reserved.

Given that all the future promise of a company is already reflected in its price today, it is quite a risk betting a large part of your assets on just a few names, concentrated, for example, in the technology sector.  The top 8 technology stocks in the US now have a larger market capitalisation than every other non-US market except for Japan.  Dominance of companies, sectors and markets ebb and flow over time.  Who is the next Amazon?  What regulatory pressures could these dominant companies face?  Is Donald Trump’s recent rage against Twitter the start?  No-one knows.  By remaining diversified, you will own the next wave of market leaders as they emerge and dilute the impact of ebbing companies.  Whilst it is always tempting to look back with the benefit of our hindsight goggles and wish we had owned more (take your pick), US tech stocks, other growth stocks, gold etc., what matters is what is in front of us, not what is behind us.  

‘The safest port in a sea of uncertainty is diversification.’

Larry E. Swedroe, Investment Author

Risk Warning This newsletter does not constitute financial advice. Remember that your circumstances could change and you may have to cash in your investment when the value is low. The value of your investment and any income from it can go down as well as up and you may not get back the original amount invested. Past performance is not necessarily a guide to the future. If you are in any doubt you should seek financial advice.